Read More


India Just Had Its Best First Quarter for Office Leasing. Ever.
July 17, 2026



A commentary analysis of JLL India's Office Market Dynamics report for Q1 2026, and what it reveals about who is actually driving the country's office demand.
21.5 Million Square Feet Leased. The Best First Quarter on Record.
JLL India tracks office leasing across the country every quarter, and its Q1 2026 numbers landed with a milestone attached. Companies leased 21.5 million sq ft of office space between January and March, the highest first-quarter volume JLL has ever recorded for India, and comfortably above the average quarterly pace set through all of 2025.
Net absorption, the number that strips out churn and shows genuine new demand, came in at 13.7 million sq ft. That's up 7% year on year and itself a Q1 record. Vacancy fell to 14.7%, down 50 basis points from the previous quarter and the tightest the market has been in five years.
Three different records in one quarter is not noise. It's a pattern.
GCCs Took Almost Half of Every Lease Signed This Quarter
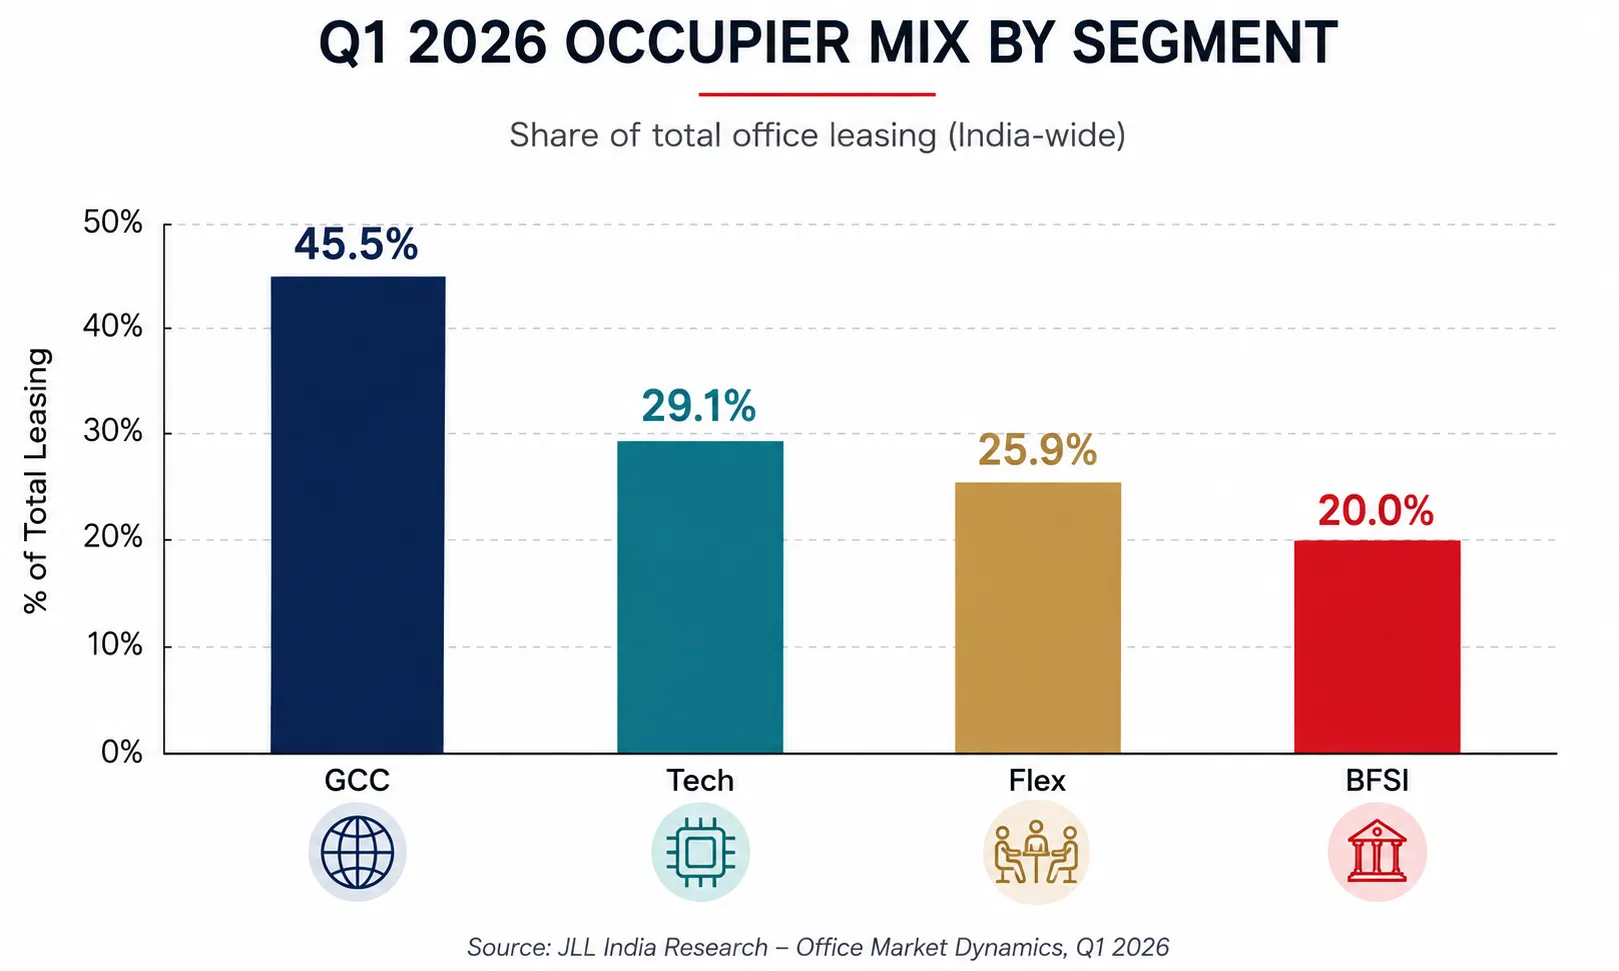
Global Capability Centres accounted for 45.5% of all office leasing in Q1 2026, JLL's single biggest number in the entire report. Tech followed at 29.1%, flex space at 25.9%, and BFSI at 20%.
That GCC figure is worth sitting with. Just over four in every ten square feet leased in India this quarter went to a captive centre run by a global company for itself, not to a domestic business, not to a third-party service provider. And GCCs weren't done: JLL's later data shows the segment had already leased 15.8 million sq ft by the halfway point of 2026, putting it on pace to beat its own 2025 record before the year is even half over.
Bengaluru captured the lion's share of that global appetite. The city took 24.8% of total Q1 leasing nationally, and a striking 33% of all leasing specifically done by foreign occupiers. When a multinational is deciding where in India to plant its flag, Bengaluru is still winning that decision more often than any other city, by a wide margin.
Flex Space Quietly Became the Second Biggest Growth Story of the Quarter
Flex operators took 25.9% of Q1 leasing, and that number matters more than it first looks. This isn't a segment growing because startups need cheap desks. JLL's data shows domestic occupiers driving a big part of this, with their overall quarterly leasing share hitting its highest level in nine quarters, largely on the back of flex adoption.
That's a meaningful shift. Domestic companies, the ones without a global parent footing the bill, are increasingly choosing flexible, managed space over a conventional long-term lease. That's a vote of confidence in the product itself, not just in the convenience of it.
Mumbai, Bengaluru, and Hyderabad Are Pulling Ahead on Pre-Commitments
JLL flags something specific happening in three cities: Mumbai, Bengaluru, and Hyderabad all posted strong year-on-year growth in Q1, and JLL attributes a meaningful part of that to pre-commitment activity, occupiers signing on for space that isn't finished yet.
Pre-commitments are a confidence signal in a way that a straightforward lease on completed space isn't. A company willing to commit to space still under construction is planning years, not months, ahead. Seeing that concentrated in exactly the three cities carrying most of the quarter's GCC and tech demand suggests the confidence is coming from the same occupiers driving the headline numbers, not a separate pocket of activity.
The Bigger Picture
Q1 2026 tells a consistent story with the H1 2026 data we've already covered from Knight Frank: India's office market isn't just holding up against global uncertainty, it's setting records because of the specific occupiers filling the space. GCCs are no longer a segment to watch, they're close to half the market. Flex space isn't a hedge anymore, it's a default choice increasingly made by domestic companies too, not just multinationals managing headcount risk.
Worth flagging one thing for anyone cross-referencing sources: JLL's 45.5% GCC figure for Q1 2026 sits meaningfully higher than the 43% national GCC share Knight Frank reported for the full H1 2026 period covering the same market. The two firms measure slightly different things, JLL by quarter, Knight Frank by half year, but the gap is a reminder that no single report should be treated as the definitive read on where GCC demand actually stands. Reading multiple sources side by side is the only way to get a fuller picture.
We'll keep tracking JLL's research alongside other major industry sources to build an ongoing, evidence backed picture of where India's commercial real estate market is headed next.
This commentary references JLL India's "Office Market Dynamics, Q1 2026" report and related press materials.
More Insights



.png)

%20(1).webp)
Thank you for your comment! It has been successfully submitted and will appear once it has been reviewed and approved.