Read More


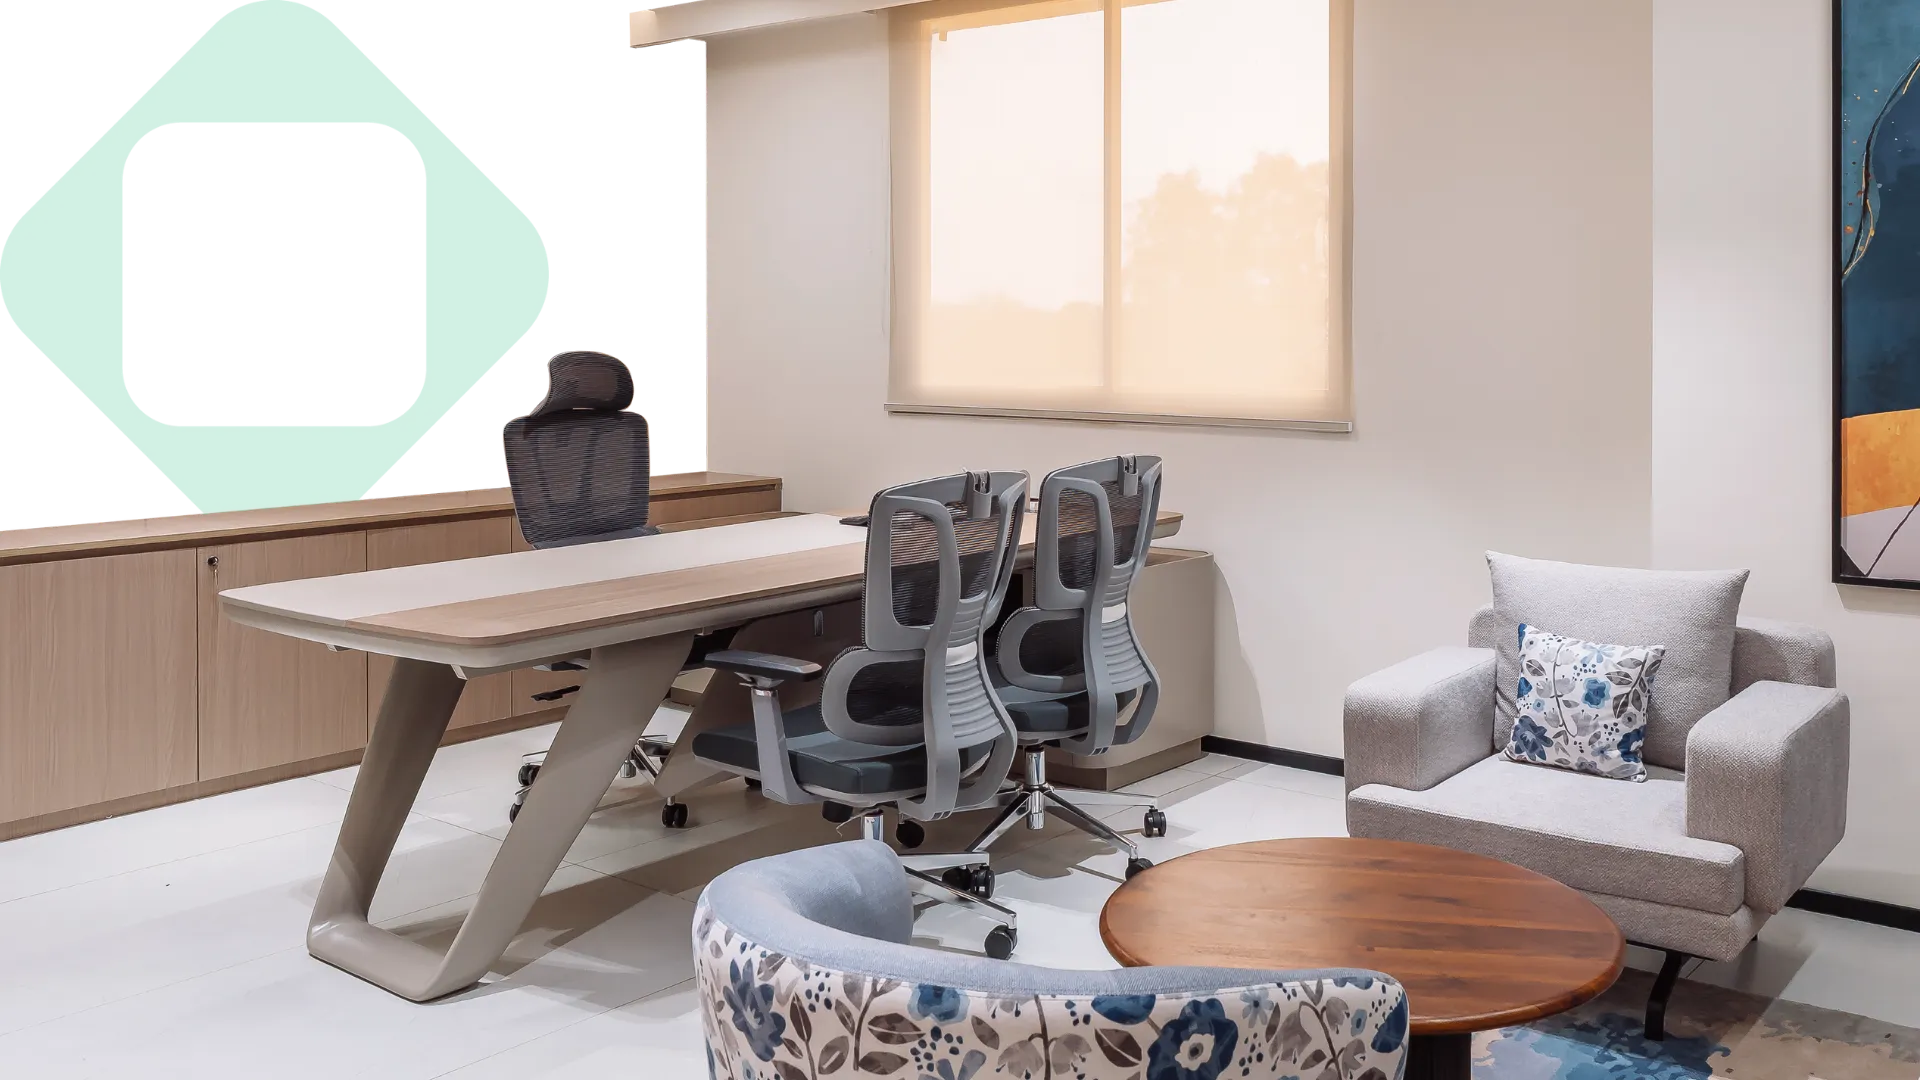
Flex Just Grew 77% in a Single Quarter. Colliers' Q1 2026 Data Shows It Is No Longer a Side Story.
September 1, 2026



A commentary analysis of Colliers' India office research for Q1 2026, and what a fast-changing occupier mix signals for the year ahead.
Key Takeaways
- India's top seven cities recorded 18.3 million sq ft of office leasing in Q1 2026, a 15% rise year on year.
- Flexible workspace leasing jumped 77% year on year to nearly 4 million sq ft, lifting flex to a 21% share of all leasing.
- GCCs accounted for close to half of total demand, while technology and BFSI together drove two-thirds of conventional leasing.
- Vacancy fell about 90 basis points year on year to 15.3%, with four of the seven markets tightening by at least 100 basis points.
- New supply reached 11.8 million sq ft, up 19% year on year, with Bengaluru alone contributing nearly half of it.
What Colliers Tracks in Its India Office Research
Colliers, a global real estate advisory firm, publishes regular research on India's office market covering gross leasing, new supply, vacancy, rents, and the balance between conventional and flexible space across the country's top seven cities. Its Q1 2026 analysis, released in early April, reads the January to March quarter against both the previous year and the firm's wider outlook for 2026. The value of the Colliers view is that it pairs a quarterly snapshot with a full-year forecast, so the near-term numbers arrive with a sense of direction attached.
A Strong Start to 2026, With the Mix Shifting Underneath
India's office market opened the year with 18.3 million sq ft of leasing in Q1 2026, up 15% on the same quarter of 2025. New supply kept pace at 11.8 million sq ft, a 19% annual rise. On the surface this looks like more of the same healthy growth the market has delivered for a while. Underneath, the composition of that demand is moving in a way that deserves attention, because the share taken by flexible workspace has climbed to a level that changes how portfolios are being built.
Flexible Workspace Grew Faster Than Anything Else on the Board
The standout number in Colliers' quarter is flex. Flexible workspace operators leased close to 4 million sq ft in Q1 2026, a 77% jump over the same period a year earlier, and that pushed their share of overall leasing to 21%, up from 14% a year ago.
A near-doubling in a single year is not a market testing an idea. It is a market adopting one. Occupiers are folding flexible space into their core real estate strategy for reasons that have become structural rather than temporary, including the ability to scale up or down without renegotiating a lease, to enter a new city quickly, and to keep fit-out capital off their own books. The pattern is uneven across cities in a telling way. In Kolkata and Delhi NCR, flex operators drove at least 40% of all leasing in the quarter, while Delhi NCR and Hyderabad together accounted for more than 45% of national flex demand. Where flexible space leads a city outright, it has stopped being an alternative and become the default.
Conventional Demand Still Runs on Technology and Banking
For all the momentum in flex, the bulk of the market remains conventional leasing, which held at 14.4 million sq ft in the quarter. Two sectors carried most of it. Technology and BFSI, meaning banking, financial services and insurance, together drove nearly two-thirds of conventional demand, with a combined 9.5 million sq ft leased. Technology alone accounted for 36% of conventional uptake. The geographic concentration within these sectors is worth noting, with Bengaluru and Mumbai leading banking demand, and Bengaluru and Hyderabad together taking more than 60% of technology leasing.
Bengaluru and Hyderabad Carried Half the Quarter Between Them
Two cities did the heavy lifting. Bengaluru and Hyderabad together accounted for nearly half of all quarterly leasing, contributing a combined 8.7 million sq ft. The rest was spread fairly evenly, with Mumbai, Pune, Delhi NCR, and Chennai each recording between 2 and 3 million sq ft.
The more interesting movement was in the growth rates. Office demand in both Hyderabad and Pune more than doubled year on year in the quarter, a sign that occupier interest is deepening in markets beyond the single largest hub. On supply, Bengaluru contributed close to 47% of new completions, with Delhi NCR adding 17%, which keeps the near-term development pipeline heavily weighted toward the two largest markets even as demand broadens.
Falling Vacancy Is Quietly Handing Power to Landlords
Because demand kept outpacing new supply, national vacancy fell by close to 90 basis points over the year to about 15.3% by the end of Q1 2026. Four of the seven major markets tightened by at least 100 basis points. Average rents across the top seven cities rose around 6% year on year.
Falling vacancy paired with rising rents is the clearest sign of a market tilting toward owners of quality space. As the best buildings fill, occupiers lose leverage, and the firms that hold well-located, well-specified assets gain the ability to hold firm on terms. For occupiers, the practical lesson is that the cost of waiting is rising, both in rent and in reduced choice.
Reading the Quarter as a Turning Point
The Colliers quarter is easy to summarize as another period of healthy growth, but that undersells what the numbers are showing. The market is not just getting bigger. It is reorganizing around flexibility, around a handful of deepening hubs, and around a tighter supply of the buildings occupiers actually want. The 77% jump in flex is the number that will look most significant in hindsight, because it marks the moment flexible space stopped being something occupiers experimented with and became something they plan around. For developers and operators, the direction of travel is now clear enough to build toward with confidence.
Source note: all leasing, supply, vacancy, and rent figures above are Colliers' own, from its India office research for Q1 2026 (Colliers, April 2026). We have restated them in our words and added our analysis. For the complete research, refer to Colliers' original publication.
More Insights





.png)

%20(1).webp)
Thank you for your comment! It has been successfully submitted and will appear once it has been reviewed and approved.